
Exploring the dynamics of casual and annual riders within Cyclistic's bike-share system
A deep dive into data analytics and visualization
SQL, Python and Tableau
Overview
In this project, I took on the role of a marketing analyst for Cyclistic, a successful bike-share company that launched in 2016. Cyclistic's unique selling proposition lies in its flexible pricing plans, which cater to a wide range of customers, including casual riders and annual members. The project was conceived as part of the Google Data Analytics Professional Certificate capstone project, focusing on a critical business challenge set forth by the company's marketing director, Moreno.
Objective
The primary goal was to devise effective marketing strategies to convert casual riders into annual members. To achieve this, it was essential to understand the distinct behaviors and preferences of annual members versus casual riders, utilizing Cyclistic's historical bike trip data.
Key Findings
The analysis revealed several key insights:
Insights
Data Source
The analysis was based on an extensive dataset provided by Motivate International Inc., covering over 5 million bike trips from January 2023 to December 2023. This dataset includes detailed information about each trip, such as ride ID, rideable type, start and end times, station names and IDs, and geographical coordinates.
Technical Skills Highlighted:
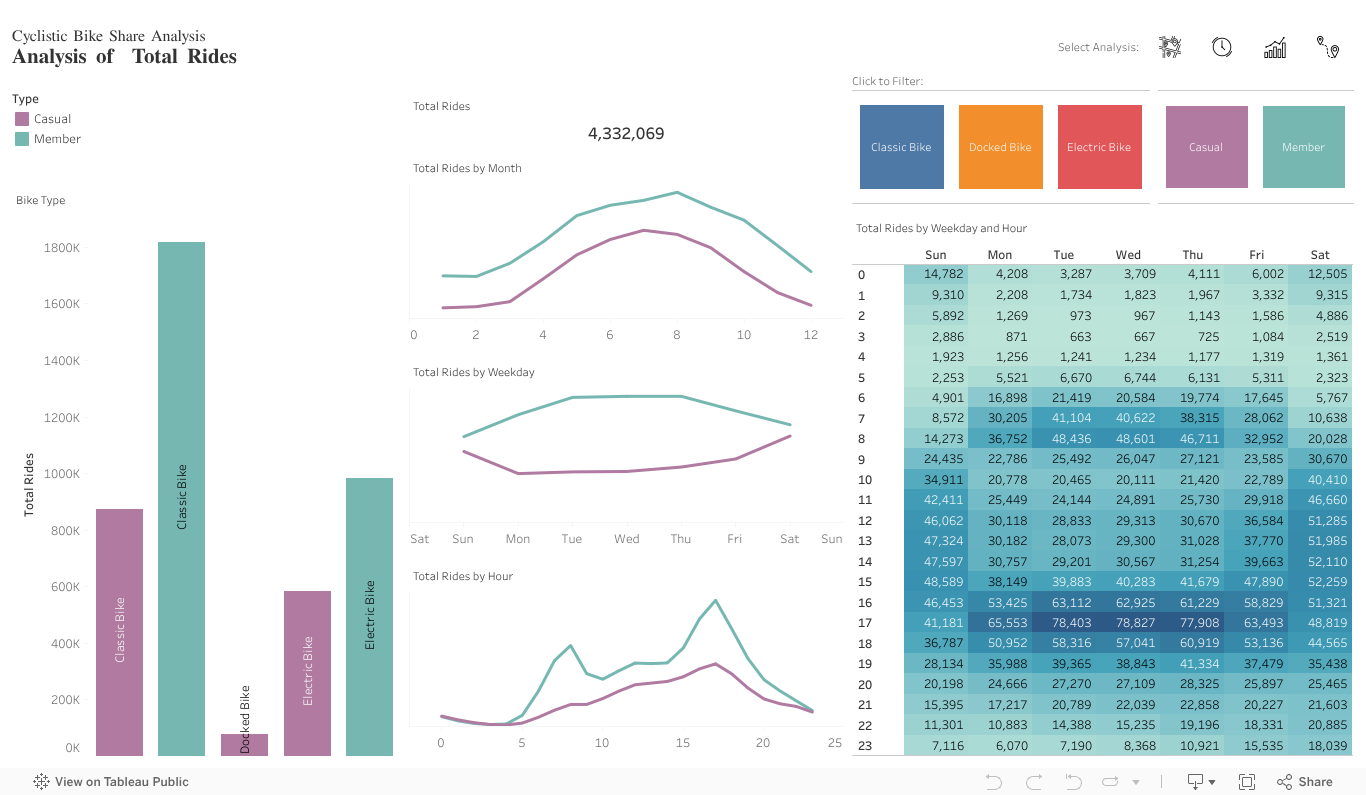
Data Analysis and Visualization
After cleaning the data, I imported it into Tableau to create insightful visualizations and dashboards. The analysis focused on comparing the usage patterns of annual members and casual riders, examining aspects such as ride frequency, duration, preferred bike types, and usage by time of day, week, and month.
Reflection
This project not only allowed me to apply and enhance my data analytics skills but also offered a real-world perspective on how data-driven strategies can impact business decisions. The challenges encountered, particularly in data processing and analysis, have enriched my problem-solving skills and my ability to derive actionable insights from complex datasets.
(+44) 07466683765
Birmingham, UK